Create multi-panel maps in RStudio using ggplot2
Introduction
There are several ways to create maps in R. In this course, we will use the ggplot2 package to make maps. Creating maps in R with ggplot2 offers a powerful and versatile approach to visualizing spatial data (Raster and Vector), integrating mapping tasks into data analysis workflows, and producing customizable high-quality maps for various applications in research and education. In this tutorial, we'll use ggplot2 to create high-quality multi-panel maps.
In this course, you will learn how to design graphs and maps using ggplot2 to meet the publication standards of a scientific journal. This entails following best practices in data visualization to effectively communicate the results of your research and contribute to advancing knowledge in your field.
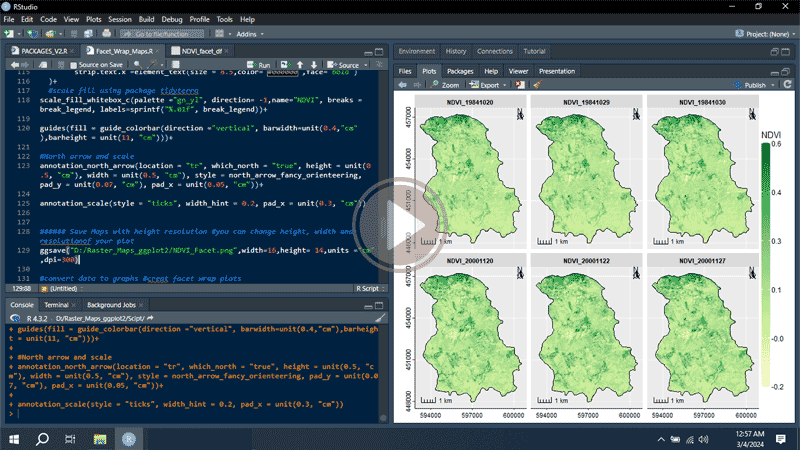
One of the most powerful aspects of the ggplot2 package is the ease of creating maps and graphs in the form of facets using facet wrap(). Faceted maps allow for easy comparison of results.
In the following example, we will use raster data to create beautiful faceted maps. The steps we have followed are listed below. The next steps will help you to create graphs and maps that effectively communicate the results of your research.
The use of this article and video (link below) is highly recommended for mastering map creation in RStudio with ggplot2.
Run the packages already installed
library(ggplot2)
library(raster)
library(sf), library(reshape2)
library(viridis)
library(tidyterra)
library(ggspatial)
1. Create a map in RStudio using ggplot2
A. Import data and create data frame (df)
Boundary <- st_read("D:/Raster_Maps_ggplot2/Study_Area/Boundary.shp", stringsAsFactors=FALSE)
NDVI <- raster("D:/Raster_Maps_ggplot2/NDVI_Layer/NDVI_19841020.img")
NDVI_df <- as.data.frame(NDVI, xy = TRUE) %>%
melt(id.vars = c('x','y'))
names(NDVI_df)[4]<- "NDVI"
NDVI_omit <- na.omit(NDVI_df) # Remove No data (NA) from data frame in r
B. Plot map using ggplot2
ggplot() +
geom_raster(data = NDVI_omit, aes(x = x, y = y, fill = NDVI)) +
geom_sf(data = Boundary, fill=NA, color="#000000", linewidth =.7)+
coord_sf(datum = st_crs(Boundary))+
scale_x_continuous(breaks = seq(594000 , 600500, 3000))+
scale_y_continuous(breaks = seq(448000, 457000, 3000))+
theme(axis.title.x = element_blank(),
axis.title.y = element_blank(),
axis.text.x = element_text(size = 8.5,color="#000000",angle=0),
axis.text.y = element_text(size = 8.5,color="#000000",angle=90, hjust=0.5),
axis.line = element_line(size = 0.5, color="#000000"),
strip.text.x =element_text(size = 8.5,color="#000000",face="bold"),
legend.position = c(0.92, 0.77),
legend.background = element_rect(fill=alpha('#ededed', 0)))+
scale_fill_viridis(option = "viridis",direction =-1, name ="NDVI",breaks =seq(-1,1,0.1))+
guides(fill = guide_colorbar(direction ="vertical",barwidth=unit(0.5,"cm"),barheight = unit(4, "cm")))+
annotation_north_arrow(location = "tl", which_north = "true", height = unit(0.5, "cm"), width = unit(0.5, "cm"), style = north_arrow_fancy_orienteering, pad_y = unit(0.2, "cm"), pad_x = unit(0.1, "cm"))+ # north arrow youcan use : tl, tr, bl and br
annotation_scale(style = "ticks", width_hint = 0.2, pad_x = unit(0.3, "cm"))
C. Save Maps with height resolution
ggsave("D:/Raster_Maps_ggplot2/NDVI.png",width=12,height= 14,units ="cm",dpi=300)
2. Create multi-panel maps in RStudio using ggplot2
A. Import data and create data frame (df)
To begin, we will create a list of raster files using the list.files() function. This list will be used to generate a LayerStack. We will only add files with a .img extension to our list. To do this, we will use the syntax pattern=".img$". If we specify full. names = TRUE, the full path of each file will be added to the list.
NDVI_Facet <- "D:/Raster_Maps_ggplot2/NDVI_Layer"
All_NDVI <- list.files(NDVI_Facet, full.names = TRUE, pattern = ".img$")
All_NDVI
NDVI_stack <- stack(All_NDVI, quick=TRUE)
NDVI_facet_df <- as.data.frame(NDVI_stack, xy = TRUE) %>%
melt(id.vars = c('x','y'))
names(NDVI_facet_df) = c("X", "Y", "Variable", "NDVI")
NDVI_facet_omit <- na.omit(NDVI_facet_df)
break_legend <- seq(min(NDVI_facet_omit$NDVI), max(NDVI_facet_omit$NDVI), len=6)
B. Plot multiple layer using ggplot2 # Create facet wrap maps
ggplot() +
geom_raster(data = NDVI_facet_omit, aes(x = X, y = Y, fill = NDVI)) +
geom_sf(data = Boundary, fill=NA, color="#000000", linewidth =.3)+
facet_wrap(~ Variable, ncol = 3)+
coord_sf(datum = st_crs(Boundary))+
scale_x_continuous(breaks = seq(594000 , 600500, 3000))+
scale_y_continuous(breaks = seq(448000, 457000, 3000))+
theme(axis.title.x = element_blank(),
axis.title.y = element_blank(),
axis.text.x = element_text(size =8.5,color="#000000",angle=0),
axis.text.y = element_text(size =8.5,color="#000000",angle=90,hjust=0.5),
axis.line = element_line(size = 0.5, color="#000000"),
legend.position = "right",
legend.margin = margin(0,0,0,-8),
legend.spacing.x = unit(0.05, 'cm'),
legend.background = element_rect(fill=alpha('#ededed', 0)),
strip.text.x =element_text(size = 8.5,color="#000000",face="bold"))+
scale_fill_whitebox_c(palette ="gn_yl", direction= -1,name="NDVI", breaks = break_legend, labels=sprintf("%.01f", break_legend))+
guides(fill = guide_colorbar(direction ="vertical", barwidth=unit(0.4,"cm"),barheight = unit(11, "cm")))+
annotation_north_arrow(location = "tr", which_north = "true", height = unit(0.5, "cm"), width = unit(0.5, "cm"), style = north_arrow_fancy_orienteering, pad_y = unit(0.07, "cm"), pad_x = unit(0.05, "cm"))+
annotation_scale(style = "ticks", width_hint = 0.2, pad_x = unit(0.3, "cm"))
C. Save Maps with height resolution
ggsave("D:/Raster_Maps_ggplot2/NDVI_Facet.png",width=16,height= 14,units ="cm",dpi=300)
3. View Distribution of Raster Values
A. Convert data to graphs
ggplot(NDVI_facet_omit, aes(x=NDVI)) +
geom_histogram(bins = 30, fill="#69b3a2", color="#e9ecef")+
facet_wrap(~ Variable, ncol = 3)+
theme(axis.title.x = element_blank(),
axis.title.y = element_blank(),
axis.text.x = element_text(size =8.5,color="#000000",angle=0),
axis.text.y = element_text(size =8.5,color="#000000",angle=90,hjust=0.5),
axis.line = element_line(size = 0.5, color="#000000"),
strip.text.x =element_text(size = 8.5,color="#000000",face="bold"))
B. Save Plots with height resolution
ggsave("D:/Raster_Maps_ggplot2/Distri_Facet.png",width=16,height= 14,units ="cm",dpi=300)
To master the course, follow the video step by step. If you have any questions, leave me a comment. Enjoy this advanced level course on RStudio for free.
Video : Plot multiple layers using ggplot2
Watch the video on YouTube
